What 5,000 DEXA Scans in Kansas City Reveal
We pulled a sample of about 5,000 DEXA scans from the Kansas City area, and it showed us something most people never get to see: what the people around them actually look like on the inside. We first shared these findings as four short posts between June 30 and July 8, 2026. This is the combined version.
A DEXA scan uses a very low dose of x-rays to split the body into fat, lean tissue and bone. That is why it can report four things a scale and a mirror can’t: body fat percentage, visceral fat, bone density and where your muscle is.
Average body fat percentage
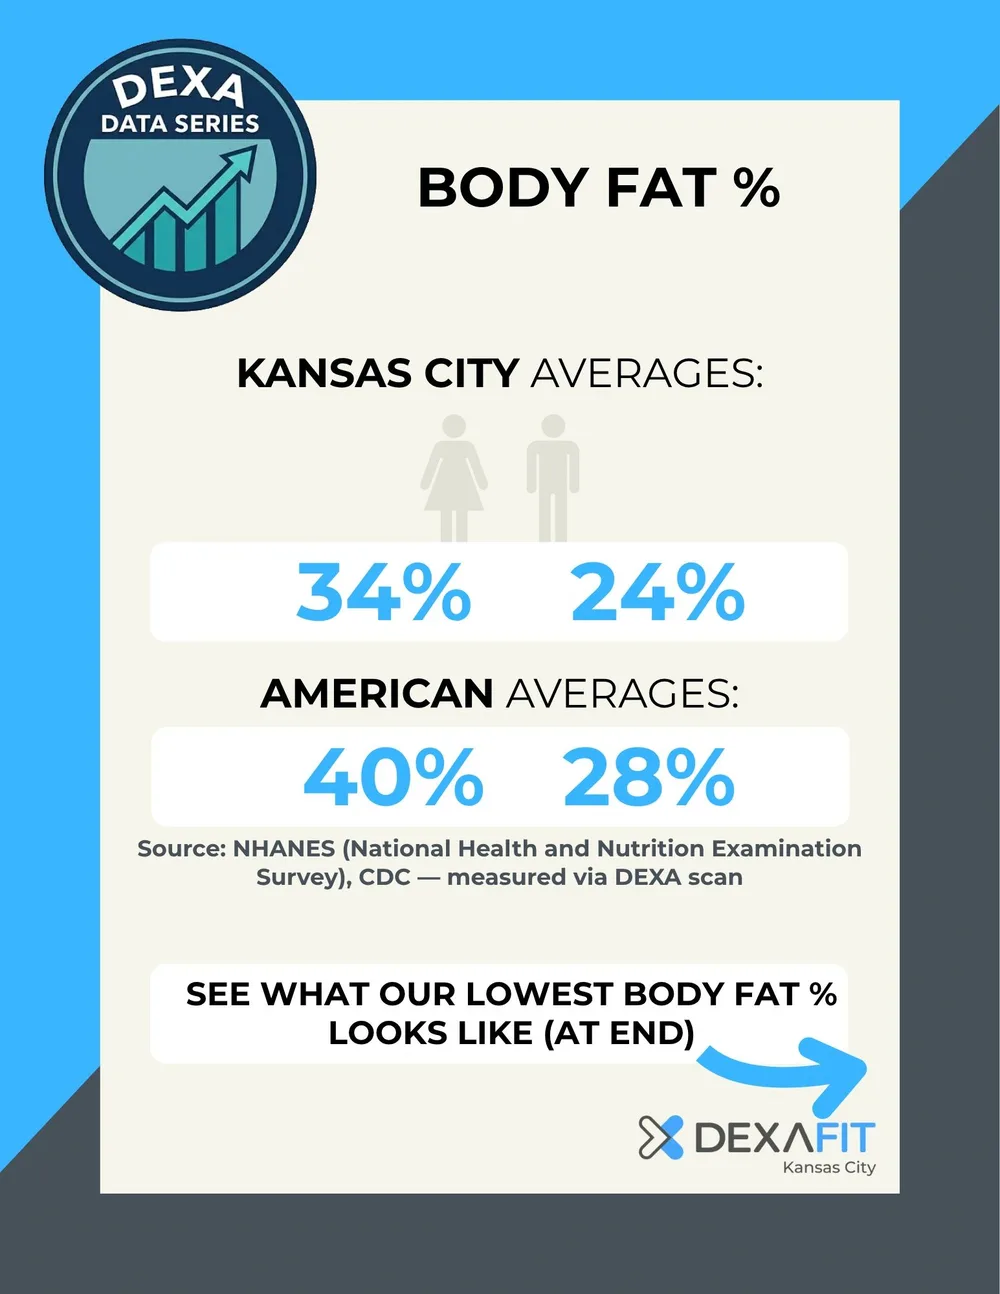
| Women | Men | |
|---|---|---|
| Kansas City sample | 34% | 24% |
| American average | 40% | 28% |
The American figures come from NHANES (the National Health and Nutrition Examination Survey run by the CDC), which also measures body fat with DEXA.
The Kansas City numbers are lower, but read that with care. People who pay for a DEXA scan are usually already paying attention to their health, so this sample is not a random slice of the city.
Visceral fat: the fat you can’t see
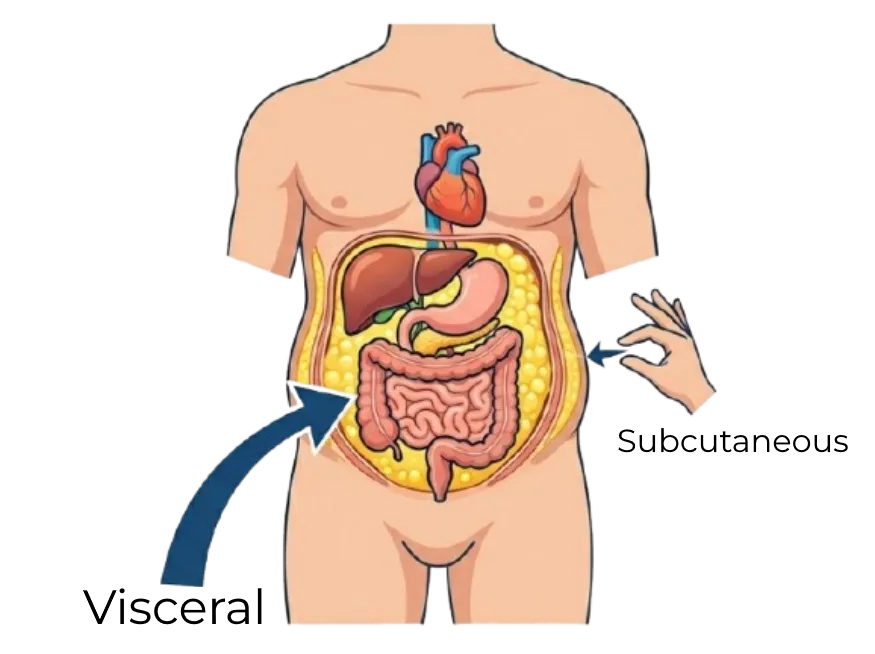
Subcutaneous fat is the fat under your skin, the part you can pinch. Visceral fat sits deeper, around your organs, and it is the type doctors care most about. You can’t judge it by looking in a mirror, but a DEXA scan estimates it in pounds.
Average visceral fat in the Kansas City sample, in pounds:
| Age | Women | Men |
|---|---|---|
| 18-19 | 0.42 | 0.57 |
| 20-24 | 0.63 | 0.82 |
| 25-49 | 1.11 | 1.77 |
| 50+ | 1.59 | 2.73 |
Two patterns stand out. Visceral fat climbs with every age bracket, and men carry noticeably more than women of the same age. The 25-49 bracket covers a wide span of years, so the averages there hide a lot of variation.
Bone density
Bone density is one of those things many people hear about but don’t entirely understand. A DEXA report gives three numbers:
- BMD, the bone mineral density itself.
- T-score, which compares your bone density to a healthy young adult. A T-score of -1.0 or higher is considered normal, and the further below that you go, the greater the concern.
- Z-score, which compares you to people of your own age and sex.
Kansas City averages:
| T-score | Z-score | BMD | |
|---|---|---|---|
| Women | 1.37 | 1.26 | 1.23 |
| Men | 1.60 | 1.19 | 1.37 |
The average person in this sample is above the young-adult reference point and above their own age group. The same selection caveat applies, since people who get scanned skew toward the active. The source infographic does not state units for BMD, so we have left them off.
How much muscle should you have?
We don’t have a single “right” number to hand you here. These are the measures worth looking at instead, and they are better than scale weight:
- ALMI (appendicular lean mass index): arm and leg lean mass compared to height. Used for longevity and sarcopenia prevention, which is age-related muscle loss.
- FFMI (fat free mass index): total body non-fat mass compared to height. Also a longevity and sarcopenia measure.
- Symmetry: lean mass on the right side of a region compared to the left. This matters for injury prevention, since a large gap between sides is a flag.
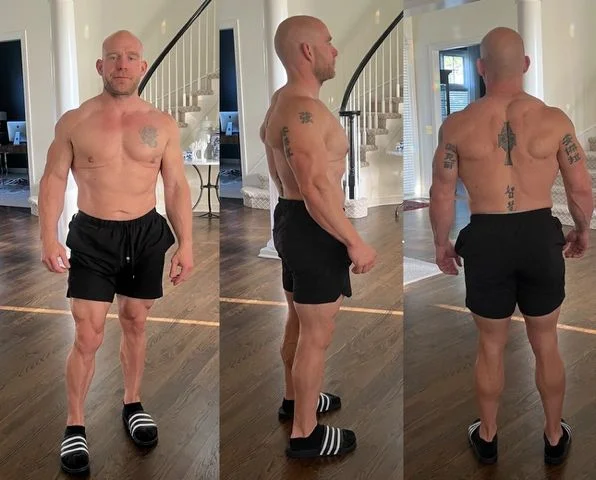
Weight alone can’t tell you whether a change came from fat or from muscle. These three can.
What we take from it
- Most people don’t know their own numbers, and the averages above are a useful reference for where someone might stand.
- Visceral fat is the one worth watching as you age, because it is the one you can’t see.
- Averages describe a group. The best comparison is you against your own scan from six months ago.
This post is information, not medical advice. Talk to your doctor about what your results mean for you.